Просмотр новости
Найдите то, что Вас интересует
 Спутники
 РН
РН SpaceX
 Роскосмос
 NASA
NASA
СпутникиРНSpaceXРоскосмосNASANicely written piece!! This post is better than many I've seen elsewhere.
The great depression officially began with the stock market crash on September 4, 1929. But for over 50% of the U.S. population who lived on farms the Depression began ten years earlier with the dramatic fall of commodity prices when demand from Europe dried up at the end of WWI. Much of the “Roaring” part of the Twenties was the result of loose credit and stock market speculation. This speculation is thought to have sown the seeds of the great depression.
The stock market crash caused a panic and thus a liquidity crisis as banks and other lenders became risk adverse and refused to loan money. The stock market actually began rebounding in early 1930, and returned to early 1929 levels by April. But because of the parabolic rise in stock prices in 1929, this was still almost 30% below the peak of September 1929.
Many economists believe that government tight money policies made the Depression worse and that the Federal Reserve did exactly the wrong things. According to the Keynesians, although President Roosevelt tried public works, farm subsidies, and other devices to restart the US economy, he never spent enough to bring the economy out of recession until the start of World War II.
Monetarists, including Milton Friedman, argue that the Great Depression was mainly caused by monetary contraction, they believe that the Federal Reserve allowed the money supply as measured by the M2 money supply to shrink by one-third from 1929–1933, thereby transforming a normal recession into the Great Depression.
The Austrian School of Economics also blames the FED but rather than not doing enough they believe that the key cause of the Depression was the FED’s expansion of the money supply in the 1920s that led to an unsustainable credit-driven boom. In February 1929 Austrian economist Friedrich Hayek published a paper predicting the Federal Reserve’s actions would lead to a crisis starting in the stock and credit markets. According to Murray Rothbard, who wrote America’s Great Depression, government intervention delayed the market’s adjustment and made the road to complete recovery more difficult.
Marxists blamed the rich, believing that recessions and depressions are the result of having no restrictions on the accumulation of capital and when too much capital is in too few hands recessions result. Hoover and Roosevelt attempted to remedy this problem with large government work projects. Sowing seeds of Socialism in the American economy in the New Deal and public works projects.
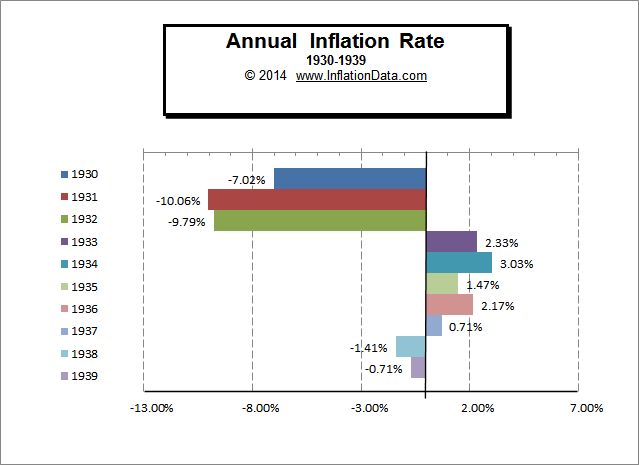
Inflation and Deflation During the Great Depression of the 1930’sBy looking at the flow of red ink in this table we can see that the majority of the deflation occurred from 1930-1932 but it resumed again in 1938-39. These are not monthly rates but annual inflation rates. Therefore any negative cell represents net falling prices for the previous 12 months.
| Year | Jan- | Feb- | Mar- | Apr- | May- | Jun- | Jul- | Aug- | Sep- | Oct- | Nov- | Dec- |
| 1930 | 0.00% | -0.58% | -0.59% | 0.59% | -0.59% | -1.75% | -4.05% | -4.62% | -4.05% | -4.62% | -5.20% | -6.40% |
| 1931 | -7.02% | -7.65% | -7.69% | -8.82% | -9.47% | -10.12% | -9.04% | -8.48% | -9.64% | -9.70% | -10.37% | -9.32% |
| 1932 | -10.06% | -10.19% | -10.26% | -10.32% | -10.46% | -9.93% | -9.93% | -10.60% | -10.67% | -10.74% | -10.20% | -10.27% |
| 1933 | -9.79% | -9.93% | -10.00% | -9.35% | -8.03% | -6.62% | -3.68% | -2.22% | -1.49% | -0.75% | 0.00% | 0.76% |
| 1934 | 2.33% | 4.72% | 5.56% | 5.56% | 5.56% | 5.51% | 2.29% | 1.52% | 3.03% | 2.27% | 2.27% | 1.52% |
| 1935 | 3.03% | 3.01% | 3.01% | 3.76% | 3.76% | 2.24% | 2.24% | 2.24% | 0.74% | 1.48% | 2.22% | 2.99% |
| 1936 | 1.47% | 0.73% | 0.00% | -0.72% | -0.72% | 0.73% | 1.46% | 2.19% | 2.19% | 2.19% | 1.45% | 1.45% |
| 1937 | 2.17% | 2.17% | 3.65% | 4.38% | 5.11% | 4.35% | 4.32% | 3.57% | 4.29% | 4.29% | 3.57% | 2.86% |
| 1938 | 0.71% | 0.00% | -0.70% | -0.70% | -2.08% | -2.08% | -2.76% | -2.76% | -3.42% | -4.11% | -3.45% | -2.78% |
| 1939 | -1.41% | -1.42% | -1.42% | -2.82% | -2.13% | -2.13% | -2.13% | -2.13% | 0.00% | 0.00% | 0.00% | 0.00% |
On a monthly basis we can see prices dropping by ½% or more each month in 1930 and often by 1% or more in 1931 and by over 2% in January of 1932.
| 1930 | -0.58% | -0.58% | -0.59% | 0.59% | -0.59% | -0.59% | -1.19% | -0.60% | 0.61% | -0.60% | -0.61% | -1.83% |
| 1931 | -1.24% | -1.26% | -0.64% | -0.64% | -1.29% | -1.31% | 0.00% | 0.00% | -0.66% | -0.67% | -1.34% | -0.68% |
| 1932 | -2.05% | -1.40% | -0.71% | -0.71% | -1.44% | -0.73% | 0.00% | -0.74% | -0.74% | -0.75% | -0.75% | -0.76% |
| 1933 | -1.53% | -1.55% | -0.79% | 0.00% | 0.00% | 0.79% | 3.15% | 0.76% | 0.00% | 0.00% | 0.00% | 0.00% |
| 1934 | 0.00% | 0.76% | 0.00% | 0.00% | 0.00% | 0.75% | 0.00% | 0.00% | 1.49% | -0.74% | 0.00% | -0.74% |
| 1935 | 1.49% | 0.74% | 0.00% | 0.73% | 0.00% | -0.72% | 0.00% | 0.00% | 0.00% | 0.00% | 0.73% | 0.00% |
| 1936 | 0.00% | 0.00% | -0.72% | 0.00% | 0.00% | 0.73% | 0.72% | 0.72% | 0.00% | 0.00% | 0.00% | 0.00% |
| 1937 | 0.71% | 0.00% | 0.71% | 0.70% | 0.70% | 0.00% | 0.69% | 0.00% | 0.69% | 0.00% | -0.68% | -0.69% |
| 1938 | -1.39% | -0.70% | 0.00% | 0.71% | -0.70% | 0.00% | 0.00% | 0.00% | 0.00% | -0.71% | 0.00% | 0.00% |
| 1939 | 0.00% | -0.71% | 0.00% | -0.72% | 0.00% | 0.00% | 0.00% | 0.00% | 2.17% | -0.71% | 0.00% | 0.00% |
The following table shows the Consumer Price index for the ten years from 1930 through 1939 based upon a 1982-84 base of 100. This table provides the basis for calculating the inflation rates and we can see that in January 1930 the CPI index was 17.1 and in December nine years later it was at 14.0 resulting in a net deflation for the entire decade.
| Year | Jan- | Feb- | Mar- | Apr- | May- | Jun- | Jul- | Aug- | Sep- | Oct- | Nov- | Dec- |
| 1930 | 17.1 | 17.0 | 16.9 | 17.0 | 16.9 | 16.8 | 16.6 | 16.5 | 16.6 | 16.5 | 16.4 | 16.1 |
| 1931 | 15.9 | 15.7 | 15.6 | 15.5 | 15.3 | 15.1 | 15.1 | 15.1 | 15.0 | 14.9 | 14.7 | 14.6 |
| 1932 | 14.3 | 14.1 | 14.0 | 13.9 | 13.7 | 13.6 | 13.6 | 13.5 | 13.4 | 13.3 | 13.2 | 13.1 |
| 1933 | 12.9 | 12.7 | 12.6 | 12.6 | 12.6 | 12.7 | 13.1 | 13.2 | 13.2 | 13.2 | 13.2 | 13.2 |
| 1934 | 13.2 | 13.3 | 13.3 | 13.3 | 13.3 | 13.4 | 13.4 | 13.4 | 13.6 | 13.5 | 13.5 | 13.4 |
| 1935 | 13.6 | 13.7 | 13.7 | 13.8 | 13.8 | 13.7 | 13.7 | 13.7 | 13.7 | 13.7 | 13.8 | 13.8 |
| 1936 | 13.8 | 13.8 | 13.7 | 13.7 | 13.7 | 13.8 | 13.9 | 14.0 | 14.0 | 14.0 | 14.0 | 14.0 |
| 1937 | 14.1 | 14.1 | 14.2 | 14.3 | 14.4 | 14.4 | 14.5 | 14.5 | 14.6 | 14.6 | 14.5 | 14.4 |
| 1938 | 14.2 | 14.1 | 14.1 | 14.2 | 14.1 | 14.1 | 14.1 | 14.1 | 14.1 | 14.0 | 14.0 | 14.0 |
| 1939 | 14.0 | 13.9 | 13.9 | 13.8 | 13.8 | 13.8 | 13.8 | 13.8 | 14.1 | 14.0 | 14.0 | 14.0 |
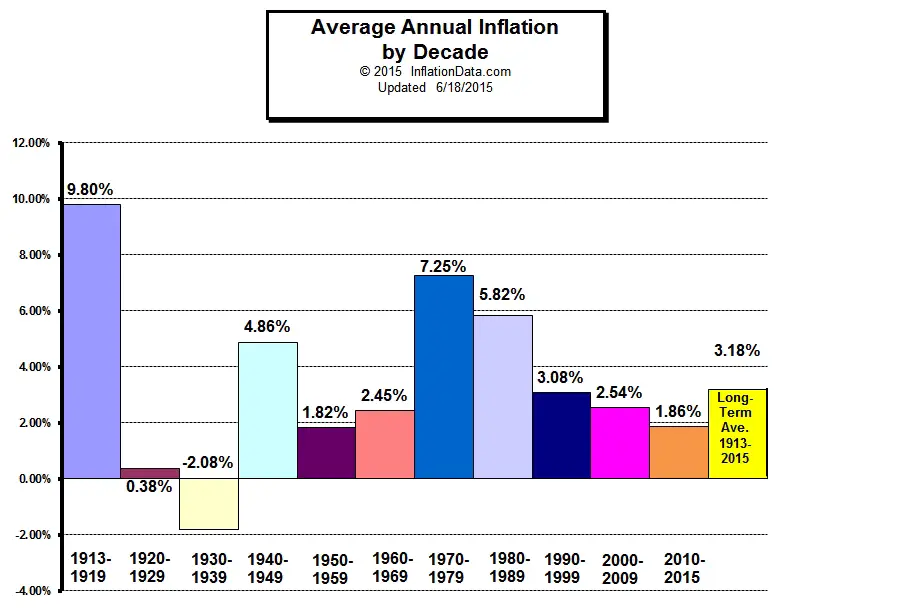
In this chart we can see how the 1930’s compare to other decades.
Click Chart for more Information
Inflation Chart 1930- 1939The following chart shows the inflation rates during the period from 1930-1939.
See Also:
| # | Наименование новости | Тональность | Информативность | Дата публикации |
|---|---|---|---|---|
| 1 | Comment on Who Does Inflation Hurt Most? by Eden Margery | 0 | 10 | 17-11-2025 |
| 2 | Comment on If Trump Won the 2020 Election Would Inflation Be Lower? by TraderJoe | 0 | 12.57 | 11-06-2026 |
| 3 | Inflationen rasar – lägre elpriser bakom fallet | 0 | 10 | 13-08-2026 |
| 4 | Comment on Best Hosting Solutions for High-Traffic Websites by Ernestina | 0 | 14.65 | 31-01-2026 |
| 5 | Nye tall viser lavere prisvekst: – Rentehåpet lever fortsatt | 0 | 7.09 | 10-07-2026 |
| 6 | Инфляция и ставка ЦБ | 0 | 5 | 20-07-2026 |
| 7 | No, We Should Not Give Up on the Goal of a 2 Percent Inflation Rate | 0 | 11.36 | 16-07-2026 |
| 8 | Comment on My Reflections: 2020 by Anureet | 0 | 19.09 | 11-01-2021 |
| 9 | Комментарий к записи В Пензенской области снизилась годовая инфляция (Гость) | -5 | 2 | 25-03-2026 |
| 10 | Comment on Why Everyone Is Talking About OPO’s AI-First Approach to Trading by ig marketing | 0 | 11.77 | 03-08-2026 |
 Click Chart for Larger Image