Просмотр новости
Найдите то, что Вас интересует
 Спутники
 РН
РН SpaceX
 Роскосмос
 NASA
NASA
СпутникиРНSpaceXРоскосмосNASA"Stranger Things" in the 2026 Arctic
The continuation of cool and stormy conditions over the Arctic Ocean during September bookends the strange summer of 2026. While global air temperatures were at or near record highs for June, July, and August, the summer was cool and stormy over the Arctic Ocean. The Arctic sea ice minimum extent tied for tenth lowest on the satellite record with 2008, 2010, and 2025, with a loose ice pack on the Atlantic side extending to the pole. However, the post-minimum freeze up has been rapid. Antarctic sea ice extent, which reached its maximum on September 14, dropped sharply through September, hitting record low daily extents since October 2.Overview of conditionsArctic sea ice extent for September 2026 averaged 4.81 million square kilometers (1.86 million square miles), thirteenth lowest in the satellite record (Figure 1a). This monthly average extent was 1.6 million square kilometers (618,000 square miles) below the 1981 to 2010 average (Figure 1b). Since the seasonal sea ice minimum that occurred on September 12, tying for tenth lowest in the satellite record, extent as of early October remains below average along the Eurasian coast, especially in the Kara and Barents Seas. While the Northern Sea route appears to be largely free of ice, significant ice remains in the southern (Amundsen’s) route of the Northwest Passage. Heavy ice cover blocks M’Clure Strait, the west end of the deepwater northern route. While a loose icepack in over the Atlantic side of the Arctic Ocean allowed the Swedish icebreaker Oden to reach the North Pole, open water areas quickly refroze after the seasonal sea ice minimum, and as of early October, extent had risen to the lower interdecile range of extents in the satellite record.
Figure 1a. Arctic sea ice extent for September 2026 was 4.81 million square kilometers (1.86 million square miles). The magenta line shows the 1981 to 2010 average extent for that month. Sea Ice Index data. About the data — Credit: National Snow and Ice Data CenterFigure 1b. This graph shows Arctic sea ice extent as of October 5, 2026, along with daily ice extent data for four previous years and the record low year. 2026 is shown in blue, 2025 in green, 2024 in orange, 2023 in brown, 2022 in magenta, and 2012 in dashed brown. The 1981 to 2010 median is in dark gray. The gray areas around the median line show the interquartile and interdecile ranges of the data. Sea Ice Index data. — Credit: National Snow and Ice Data CenterConditions in contextAs was the case for all of summer (see summer summary below), low sea level pressure dominated the Arctic Ocean during September, accompanied by below-average temperatures that fostered rapid ice growth (Figure 2a). Air temperatures at the 925 hPa level (about 2,500 feet above the surface) were 0 to 1 degree Celsius (0 to 2 degrees Fahrenheit) below average over much of the Arctic Ocean, but strongly above average over northern Eurasia (Figure 2b).
Figure 2a. This plot shows average sea level pressure in the Arctic in hectopascals for September 2026. Yellows and reds indicate high air pressure; blues and purples indicate low pressure. — Credit: NSIDC courtesy NOAA Earth System Research Laboratory Physical Sciences LaboratoryFigure 2b. This plot shows the departure from average air temperature in the Arctic at the 925 hPa level, in degrees Celsius, for September 2026. Yellows and reds indicate above average temperatures; blues and purples indicate below average temperatures. — Credit: NSIDC courtesy NOAA Earth System Research Laboratory Physical Sciences LaboratorySeptember 2026 compared to previous yearsThe downward linear trend in September Arctic sea ice extent through 2026 is 74,100 square kilometers (28,600 square miles) per year or 11.6 percent per decade relative to the 1981 to 2010 average (Figure 3). Based on the linear trend, since 1979, September has lost 3.24 million square kilometers (1.25 million square miles) of sea ice. This is equivalent to twice the size of Alaska.
Figure 3. Monthly September ice extent for 1979 to 2026 shows a decline of 11.6 percent per decade.
— Credit:
National Snow and Ice Data Center
Regional contributions to September extentFor this monthly post, we present a time series of September monthly ice extents in a new format (Figure 4). The black line depicts the overall trend. Regional differences from average for each year are shown as colored bars for each sector of the Arctic. This presents the data in a way that allows some insight into the contributions to the overall positive or negative September extent difference from average. Since 2007, with few exceptions, differences from average have been negative in all sectors; in the last century, regional differences were more varied. Since 2007, negative differences from average in the Beaufort and Chukchi Seas and in the East Siberian and Laptev Seas have remained prominent, but their magnitudes have shifted from year to year largely in response to shifting summer weather patterns.
Figure 4. This time series shows Arctic sea ice extent for the month of September as a whole (black line) along with regional differences from the 1981 to 2010 average for every year since 1979.
— Credit:
J. Stroeve, National Snow and Ice Data Center
Spring in the AntarcticAfter reaching its maximum extent on September 14, Antarctic sea ice extent sharply declined, and as of October 6, was close to the record low for the date set in 2023. As was done for the Arctic, a graph presents the September Antarctic sea ice extent time series along with differences from average for each year (Figure 5). While the low extents since 2022 stand out clearly, in each of these low years, extent was above average in some sectors. This stands in sharp contrast to the Arctic. Note how in 2022, extent was above average in the Ross Sea, shifting to below average in 2023. However, during the record maximum extents of 2012 to 2015, nearly all regions showed a positive difference from average.
Figure 5. This time series shows Antarctic sea ice extent for the month of September as a whole (black line) along with regional differences from the 1981 to 2010 average for each year since 1979.
— Credit:
J. Stroeve, National Snow and Ice Data Center
The 2026 summer melt season in summaryThe 2026 melt season in the Arctic was unusual in the extreme. Through most of May, extent was tracking at near record low levels. Starting in June, the pace of ice loss substantially slowed, and the minimum extent, which occurred on September 12, ended up as tenth lowest in the satellite record, tying with 2008, 2010, and 2025. Nevertheless, the loose ice pack on the Atlantic side of the Arctic Ocean, extending nearly to the North Pole, eased the voyage of the Swedish icebreaker Oden to the pole, carrying scientists along with tourists.A highly stormy atmospheric pattern over the central Arctic Ocean attended by cool and cloudy conditions inhibited sea ice melt. A pronounced average low pressure centered near the North Pole lingered in June, July, and August (Figure 6a). While cyclone activity over the central Arctic Ocean tends to be maximized in summer, the persistence of this cyclonic pattern was remarkable. In summer, in “free drift” conditions, where there is little floe-to-floe interaction, cyclonic (counterclockwise) winds promote the spreading of the sea ice cover, which likely accounts for the loose ice conditions just noted. Past research shows that summer cyclones that enter the Arctic Ocean, especially from Eurasia and mature in their passage, develop a cold-cored structure. Each cyclone moving into the region reinforces the persistent cold-cored, low structure, which extends into the tropopause much like a vertical stack. Interestingly, based on the ERA5 reanalysis, despite all the cyclones, summer precipitation over the Arctic Ocean as a whole was not notably above average. The attendant pattern of summer air temperature as a difference from average at the 925 millibar level (about 2,500 feet above the surface) was equally unusual (Figure 6b). When sea ice cover is melting, air temperatures will hover around the freezing point. However, over much of the ocean, temperatures remained below average. This was especially clear in June when melt started late. While temperatures over the ocean reflected the cold-cored nature of cyclone maximum and extensive cloud cover, temperatures on Arctic land were far above average over the Canadian Arctic Archipelago, western Europe, and central Eurasia.
Figure 6a. This plot shows average sea level pressure in the Arctic in millibars for June, July, and August. Yellows and reds indicate high air pressure; blues and purples indicate low pressure. — Credit: NSIDC courtesy NOAA Earth System Research Laboratory Physical Sciences LaboratoryFigure 6b. This plot shows the departure from average air temperature in the Arctic at the 925 hPa level, in degrees Celsius, for the months of June, July, and August. Yellows and reds indicate above average temperatures; blues and purples indicate below average temperatures. — Credit: NSIDC courtesy NOAA Earth System Research Laboratory Physical Sciences LaboratoryThe cyclonic pattern persisted through September. After reaching its sea ice minimum on September 12, autumn freeze up was rapid, and as of this post, extent had reached the lowest decile in the satellite record.This cyclonic pattern also played a role in the late melt out of the Beaufort and Chukchi Seas. Unusual compared to recent years, sea ice remained near the Alaskan coast into August, which is near the location of the 1981 to 2010 average. However, the ice melted rapidly and by the end of August, the region was largely ice free in the passive microwave data (though operational ice charts indicated low concentration ice).Relatively cool conditions and cyclonic pressure contributed to the late ice loss. The reason that the ice eventually did melt was because the area was dominated by first-year ice, which is thinner and more susceptible to melt out completely (Figure 6c). Overall, the Arctic sea ice cover has much less multiyear ice and thus is thinner than it was during the 1980s. Since 2007, at the end of the summer melt season, the multiyear extent has varied between 1.3 million and 1.9 million square kilometers (502,000 square miles and 734,000 square miles), significantly lower than the roughly 3.5 million square kilometers (1.35 million square miles) during the 1980s. And since 2012, the oldest, thickest ice (greater than 4-years old) has nearly disappeared, with 250,000 square kilometers (97,000 square miles) or less each year compared to the approximate 1.5 million square kilometers (579,000 square miles) before 2005. While this summer was relatively cool over the Arctic Ocean, the long-term warming trend has resulted in more melt and faster distribution of sea ice, which means that ice is not surviving nearly as long as it used to.
Figure 6c. The top left map shows Arctic sea ice age during the week of March 12 to 18, 2026, the week of the maximum extent; a larger swath of first-year ice extends into the Beaufort Sea, though older ice is found near the coast. The top right map shows Arctic sea ice age during the week of September 3 to 9, 2026, just before the minimum extent; most of the ice in the Beaufort and Chukchi Seas has melted out. The bottom time series shows extent of multiyear ice in black and ice greater than 4-years old in red at the seasonal minimum for 1985 to 2026. The oldest ice (in red) shows substantial decline.
— Credit:
Tschudi et al., 2019a and 2019b
Sea ice in the Antarctic remained below the lowest interdecile range since the beginning of the austral growth season that started in late March 2026, but above the record low of 2023 (Figure 6d). The maximum extent, reached on September 14, was the third lowest in the satellite record, repeating a recent pattern of low maximum extents discussed in more detail above. Since October 2, extent has fallen to record low daily values, surpassing 2023’s records. The post-maximum areas of loss are in the Ross and Amundsen seas, and the Indian Ocean sector (Figure 6e).
Figure 6d. The graph above shows Antarctic sea ice extent as of October 6, 2026, along with daily ice extent data for four previous years and the record 2014 year. 2026 is shown in blue, 2025 in green, 2024 in orange, 2023 in brown, 2022 in magenta, and 2014 in dashed brown. The 1981 to 2010 median is in dark gray. The gray areas around the median line show the interquartile and interdecile ranges of the data. Sea Ice Index data. — Credit: National Snow and Ice Data CenterFigure 6e. Antarctic sea ice extent for September 2026 was 17.32 million square kilometers (6.69 million square miles). The magenta line shows the 1981 to 2010 average extent for that month. Sea Ice Index data. About the data — Credit: National Snow and Ice Data Center
agnieszka.gaut…
Wed, 10/07/2026 - 14:00
Article Type
Analysis - Sea Ice Today
Publish Date
Wed, 10/07/2026 - 12:00
Geophysical Measurement
Sea ice
Featured Image
sept2026_arctic.png
Anchor links
On
News & Updates
Off
Similar Items
Off
Section
Sea Ice Today
Subject
Climate Change
Data
Weather
Geographical Area
Antarctica
Northern Hemisphere
Arctic
News Release
WEDNESDAY, SEPTEMBER 23, 2026
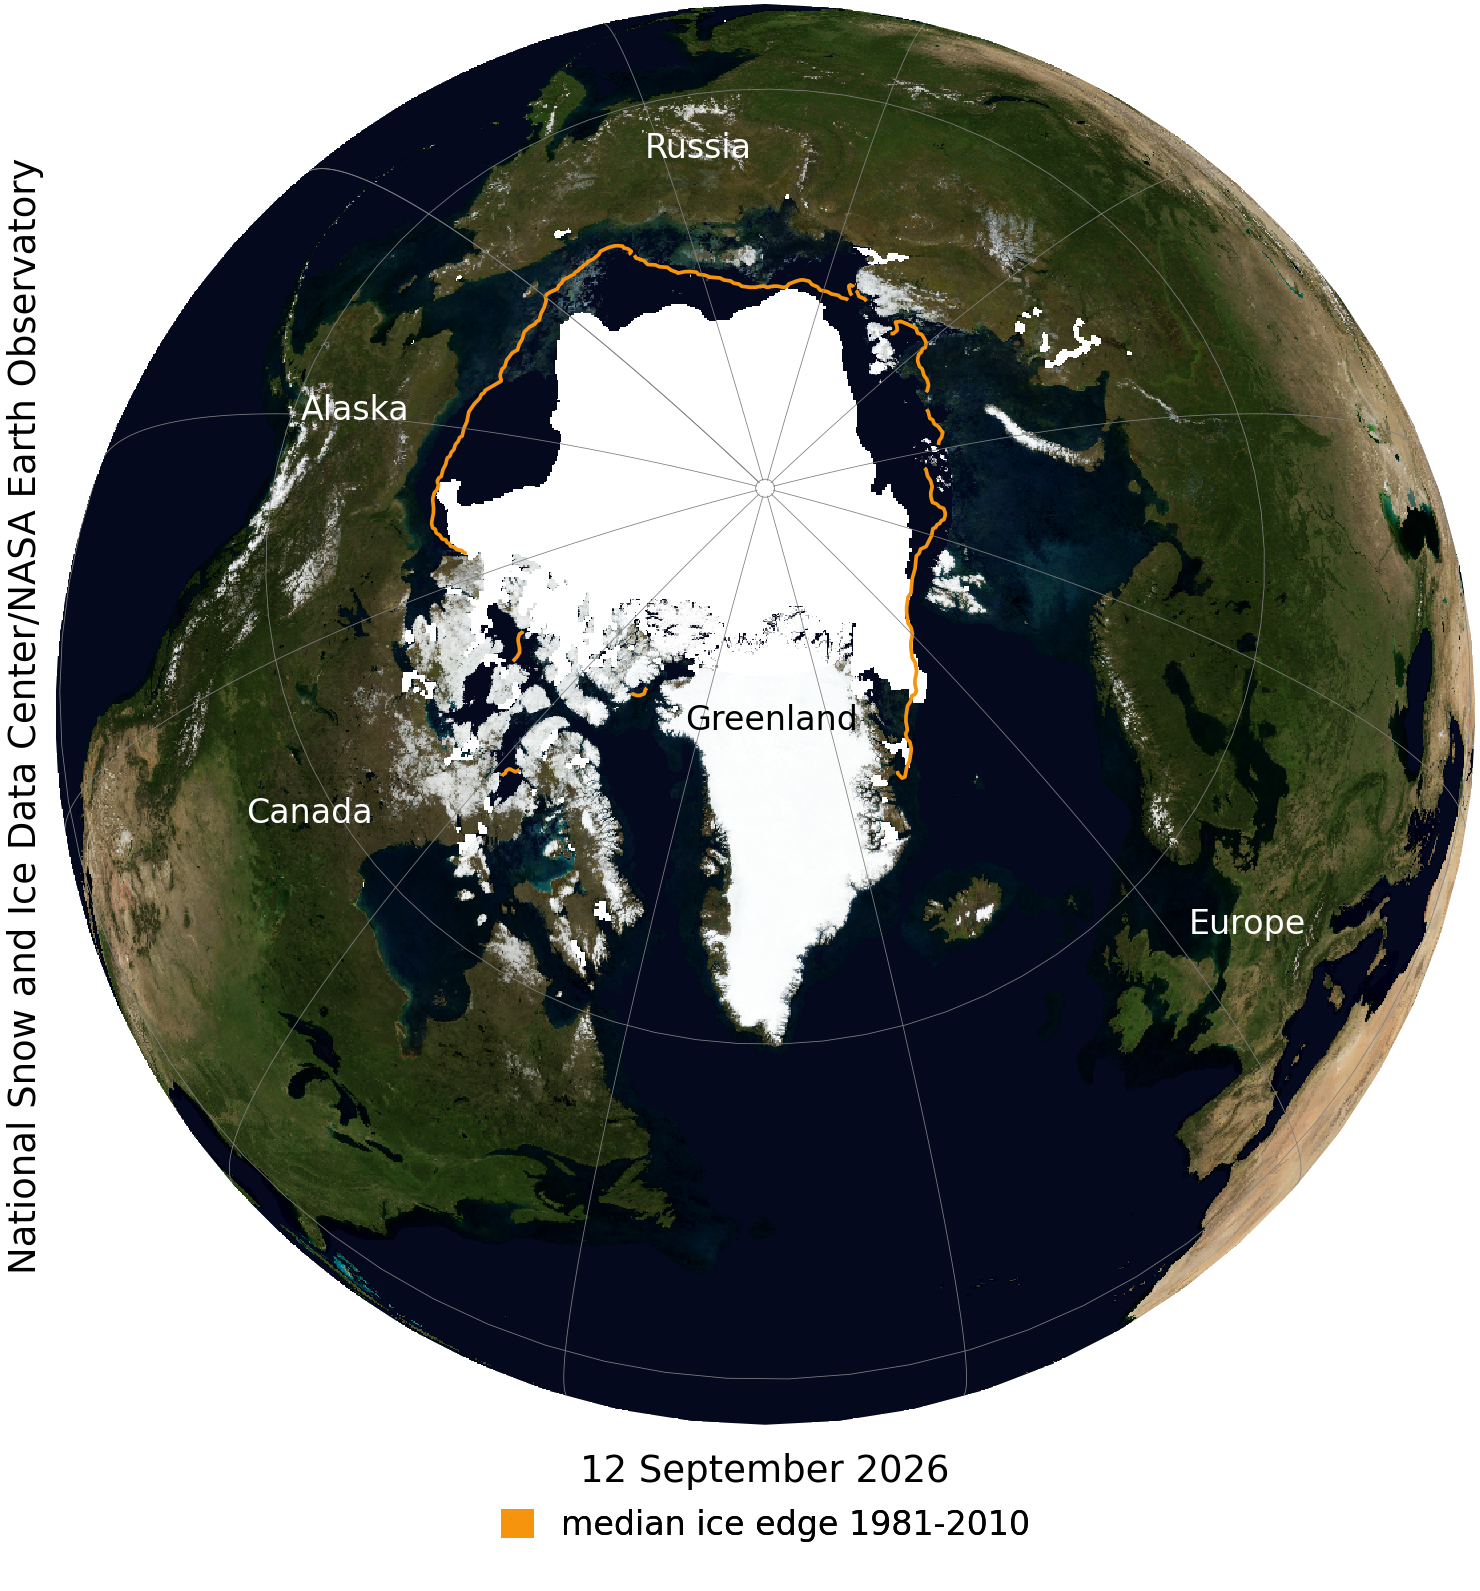
Arctic sea ice likely reached its minimum extent for the year, at 4.60 million square kilometers (1.78 million square miles) on September 12, 2026, according to scientists at the National Snow and Ice Data Center (NSIDC) at the University of Colorado Boulder. The 2026 minimum is ranked tenth lowest in the nearly 48-year satellite record, tied with 2008, 2010, and 2025. The last 20 years are the lowest 20 Arctic sea ice extents in the satellite record.
“This year’s minimum is yet another low extent in a changed Arctic,” said senior scientist Walt Meier. “While this year’s minimum is in line with recent years, it is far lower than anything we saw in the 1980s, 1990s, and early 2000s.”
NSIDC director Mark Serreze said, “It’s been a strange year. It was only tenth lowest in extent, but despite the fairly cool Arctic Ocean summer, there was loose ice all the way to the pole.”
NSIDC scientists stress that the Arctic sea ice extent number is preliminary—compaction from winds could still push the ice extent lower.
Antarctic sea ice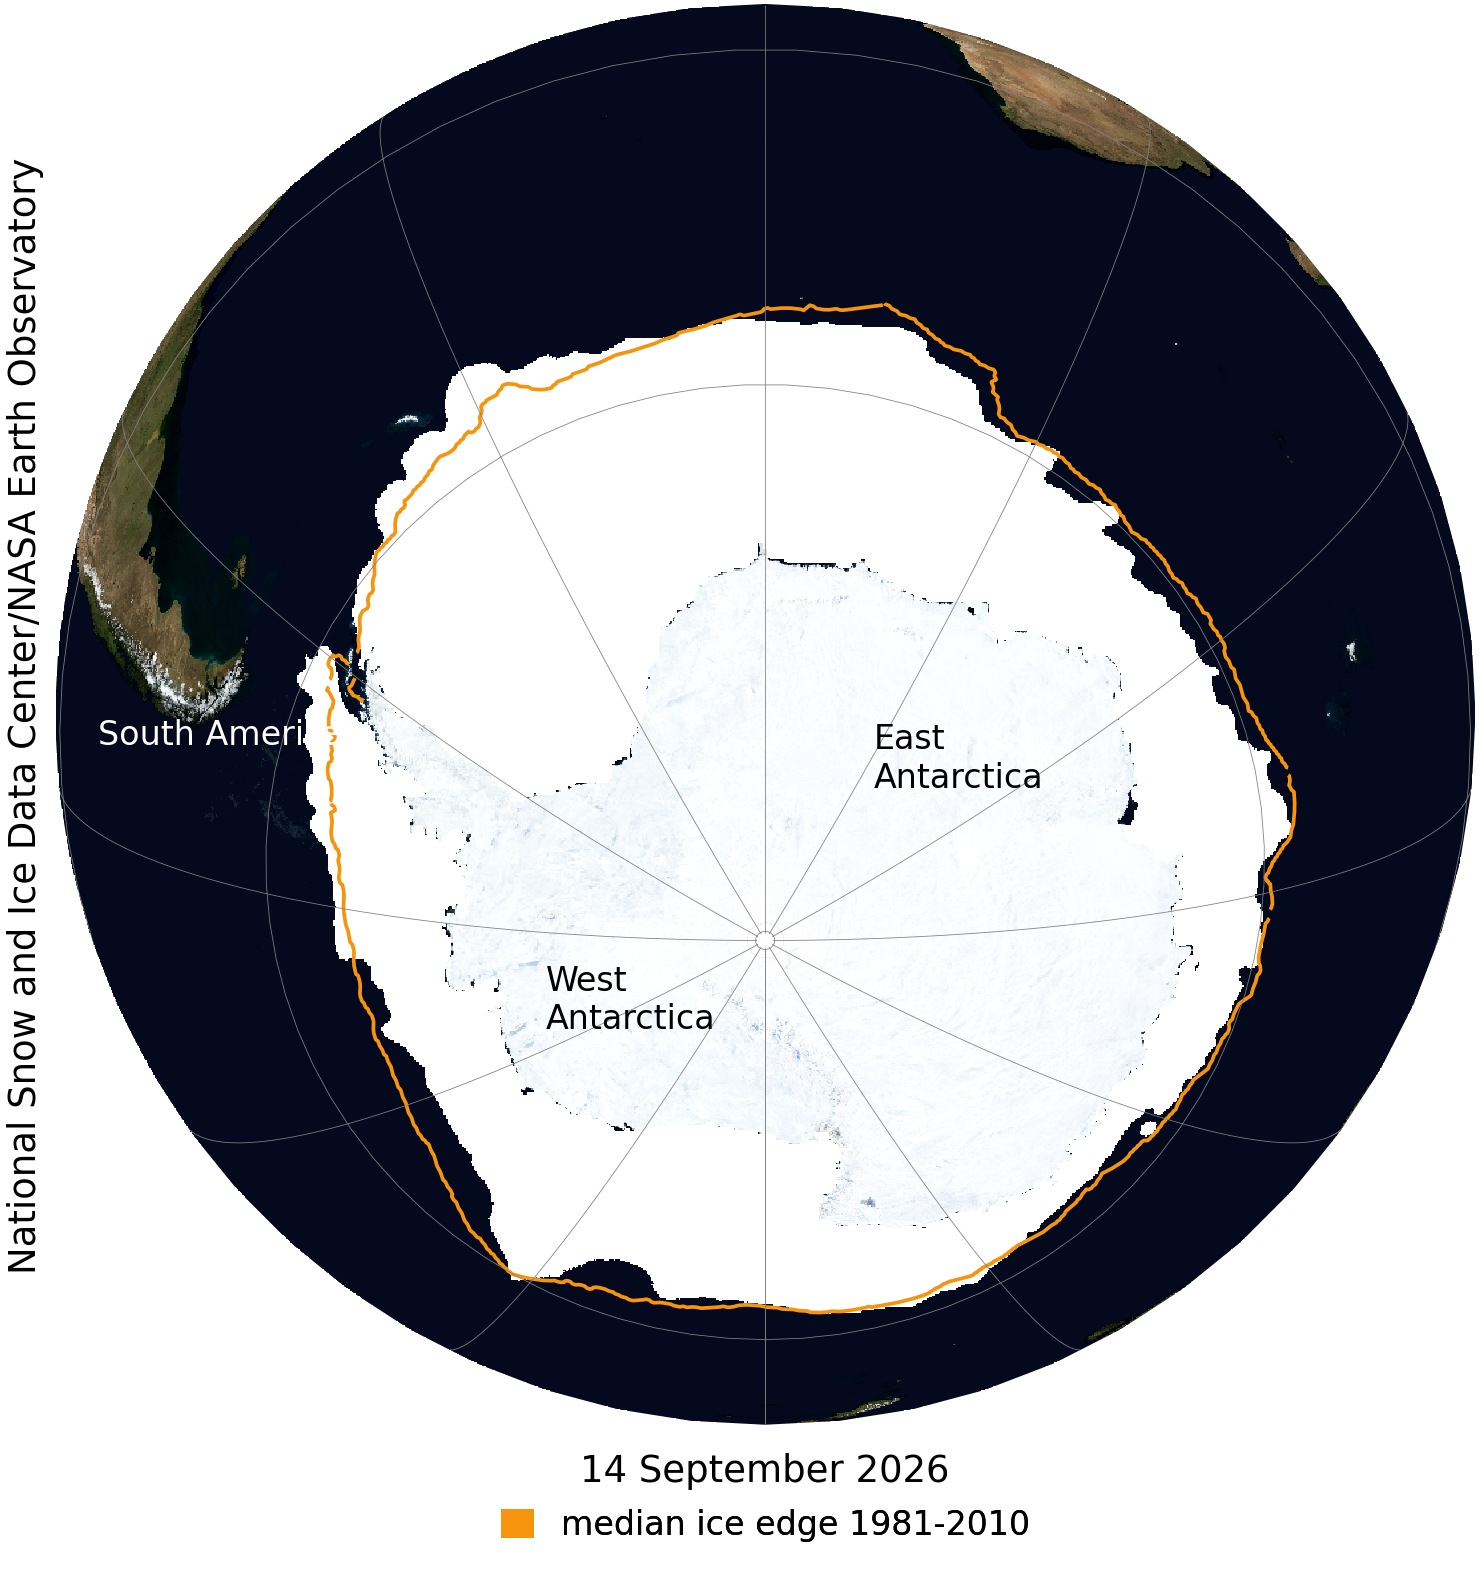
In the Antarctic, sea ice extent has been tracking near record low levels for most of the growth season, most likely reaching its maximum extent on September 14 at 17.59 million square kilometers (6.79 million square miles). If this maximum date holds, this will be the third lowest Antarctic sea ice maximum on record.
“Antarctica’s sea ice during this year's growth season has steadily lagged the long-term average,” said senior scientist Ted Scambos. “This is a continuation of below-average extent across all seasons for most of the past decade.”
It must be noted that large fluctuations in extent are typical of Antarctic sea ice near the seasonal maximum, often leading to some delay in confidently identifying the maximum, which typically occurs in late September or early October but has been reached as early as August 30.
NSIDC will issue a full analysis at the beginning of October addressing the possible causes behind this year’s ice conditions, interesting aspects of the Arctic melt season and Antarctic growth season, and graphics comparing this year to the long-term record.
NSIDC is part of the Cooperative Institute for Research in Environmental Sciences (CIRES) at the University of Colorado Boulder.
Visit NSIDC's Sea Ice Today for more details and images.
View the NASA visualization; read the NASA feature.
| # | Наименование новости | Тональность | Информативность | Дата публикации |
|---|---|---|---|---|
| 1 | Antarctic sea ice extent arrives at a near-average minimum | 0 | 9.8 | 07-03-2026 |
| 2 | Arctic sea ice record low maximum strikes again | 0 | 9.3 | 26-03-2026 |
| 3 | NSIDC turns 50 | 0 | 11.4 | 14-09-2026 |
| 4 | Navigating New Ways of Arctic Research | 0 | 9.71 | 10-09-2026 |
| 5 | Fifty years of change in the cryosphere | 0 | 9.5 | 19-08-2026 |
| 6 | Selected publications by NSIDC researchers | 0 | 9.92 | 12-09-2026 |
| 7 | To see or not to see: The reality of sea level rise | 0 | 9.1 | 01-10-2026 |
| 8 | Arctic Report Card: A Close Watch on a Warming Region | 0 | 9.5 | 01-04-2026 |
| 9 | Длительность сезона таяния в Арктике стабилизировалась | 0 | 20.5 | 25-09-2026 |
| 10 | Американские климатологи обнаружили, что многолетний тренд на увеличение продолжительности сезона ... | 0 | 11.04 | 27-09-2026 |